(abstract of solar photovoltaics)
HIGHLIGHTS
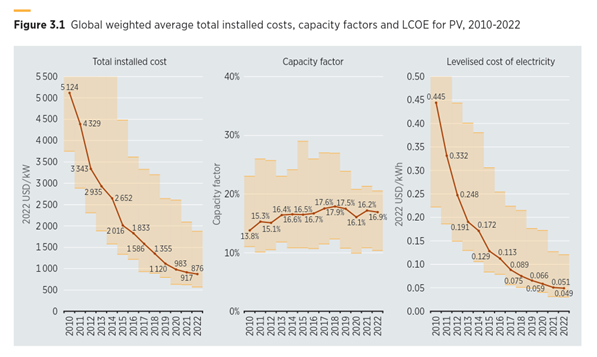
The global weighted average levelised cost of electricity (LCOE) of utility-scale photovoltaic (PV) plants declined by 89% between 2010 and 2022, from USD 0.445/kilowatt hour (kWh) to USD 0.049/kWh. In 2022, the year-on-year reduction was 3%.
At an individual country level, the weighted average LCOE of utility-scale solar PV declined by between 76% and 89% between 2010 and 2022.
The cost of crystalline solar PV modules sold in Europe declined by 91% between December 2009 and December 2022.
The global capacity weighted average total installed cost of projects commissioned in 2022 was USD 876/kilowatt (kW), 83% lower than in 2010 and 4% lower than in 2021.
Solar PV capacity grew 26-fold between 2010 and 2022, with over 1 047 gigawatts (GW) installed by the end of 2022.
On average, in 2022, balance of system (BoS) costs (excluding inverters) made up about 62% of total installed costs.
The global weighted average capacity factor for new, utility-scale solar PV increased from 13.8% in 2010 to 16.9% in 2022. This change results from the combined effect of evolving inverter load ratios, a shift in average market irradiance and the expanded use of trackers – driven largely by increased adoption of bifacial technologies – that unlock solar PV’s use in more latitudes.
RECENT MARKET TRENDS
By the end of 2022, over 1 047 GW of solar PV systems had been installed globally. This represented almost 26-fold growth for the technology since 2010. Newly installed systems totalling about 191 GW were commissioned during 2022 alone. This value is 36% more than in 2021 and represents the greatest year-on-year increase in yearly commissioned capacity since the technology grew 50% between 2015 and 2016. These new capacity additions were the highest among all renewable energy technologies that year. This has been the case for solar PV since 2016.
Asia has been the leader in installing new solar PV since 2013. Following that trend, growth in 2022 was driven by continued new capacity additions in the region, when Asia contributed about 59% of all new installations. The share of new installations in Asia was 53% during 2021 and 60% in 2020. In 2022, China drove growth in the region, accounting for around 77% of all new Asian (and about a 45% of all global) installations. Total expansion in Asia was 112 GW in 2022 (compared to 75 GW in 2021), and major capacity increases occurred in China (86 GW) and India (13.5 GW). Japan also added 4.6 GW, slightly more than in 2021. Historical markets outside Asia also continued to gain scale. The United States added 17.6 GW of solar capacity in 2022, Brazil added 9.9 GW and the Netherlands and Germany added 7.7 GW and 7.2 GW, respectively (IRENA, 2023a).
TOTAL INSTALLED COSTS
The downward trend in solar PV module costs has been an important driver of improved competitiveness historically – and this technology has shown the highest learning rates of all renewable energy technologies. Between December 2009 and December 2022, crystalline silicon module prices declined between 88% and 94% for modules sold in Europe, depending on the type. The weighted average cost reduction was on the order of 91% during that period. During December 2022, mainstream modules sold for USD 0.33/watt (W). A wide range of costs exists, however, depending on the module technology considered. Costs varied from as low as USD 0.22/W for the lower-cost modules to as high as between USD 0.43/W and USD 0.44/W for high-efficiency modules. The lower bound of that cost range is 2% higher than it was during December 2021, while the upper bound is 8% lower than what it was in December 2021 (Figure 3.2).
Accounting for about 5% of the market in 2022, thin film offerings sold for USD 0.23/W during December 2022, after a cost decline of 11% between December 2021 and December 2022. The cost of crystalline bifacial modules increased 5% during the same period. Sales of bifacial crystalline modules were 39% higher than mainstream monofacial modules during December 2020. This cost premium remained unchanged during December 2021 but fell to 23% during December 2022. This points to bifacial module costs being driven more by the cost of the cell architecture types used to build them rather than by the bifacial design itself. Driven by this narrowing cost gap and its potential for increased yield per watt when compared to monofacial technologies, bifacial modules continue to grow their market share. During 2019, the market share for these was about 8%. This share grew to around 27% during 2020, to 28% during 2021 and to 30% during 2022 (ITRPV, 2022, 2023).
Between 2018 and 2022 countries saw an average reduction of 43% in soft costs, a 36% reduction in module and inverter costs, a 28% reduction in BoS hardware costs and a 7% fall in installation costs.
LEVELISED COST OF ELECTRICITY
The global weighted average LCOE of utility-scale PV plants declined by 89% between 2010 and 2022 from USD 0.445/kWh to USD 0.049/kWh. This 2022 estimate also represents a 3% year-on-year decline from 2021 (the decline between 2020 and 2021 was 13%).
Globally, too, the range of LCOE costs continues to narrow. In 2021, the 5th and 95th percentile of projects ranged from USD 0.031/kWh to USD 0.127/kWh. In 2022, the range for this metric was between USD 0.030/kWh to USD 0.120/kWh, representing 87% and 78% declines on the 5th and 95th percentile values, respectively, in 2010. The LCOE range in 2022 (the gap between the 5th and the 95th percentile values) reached its lowest value in since 2010, after declining 6% since 2021. After remaining flat during 2018 and 2019, the 5th percentile value declined 17% between 2019 and 2020 to reach USD 0.040/kWh. Between 2020 and 2021, the decline was much starker, at 24%. It declined 3% during 2022. In 2020, the 95th percentile value remained flat in relation to its value in 2019 but declined 26% between 2020 and 2021.

This article is from Renewable power generation costs in 2022 by IRENA.